Data-Analysis Helpers
Note
These lightweight scripts live in /analysis and are meant
for quick, single-file previews of key observables.
Exactly one input file is supplied as the first positional argument.
Run them from the project root, for example:
python docs/_static/scripts/plot_PE.py results/Thermo_run1.dat
Each script prints an informative
--helpmessage describing optional flags (e.g. custom column numbers, unit conversions).
Potential-Energy Trace
| Script
plot_PE.py| Input
Thermo_<run>.dat (LAMMPS thermo dump)| Action Extracts the potential-energy column and plots energy vs step
(line plot saved as
PE.png).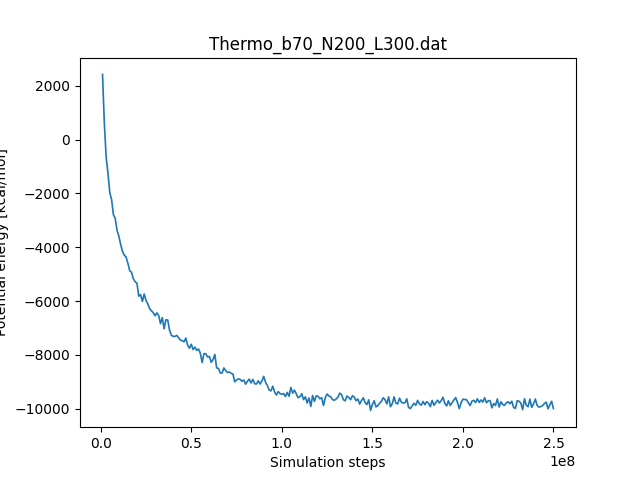
Example potential-energy trace.
Bonded-Sticker Fraction (BSF) – time series
| Script
plot_BSF.py| Input
Thermo_<run>.dat (must include a running bonds column)| Action Computes the percentage of newly formed cross-links and plots
% stickers bonded vs simulation step (figure saved as
BSF_timeseries.png).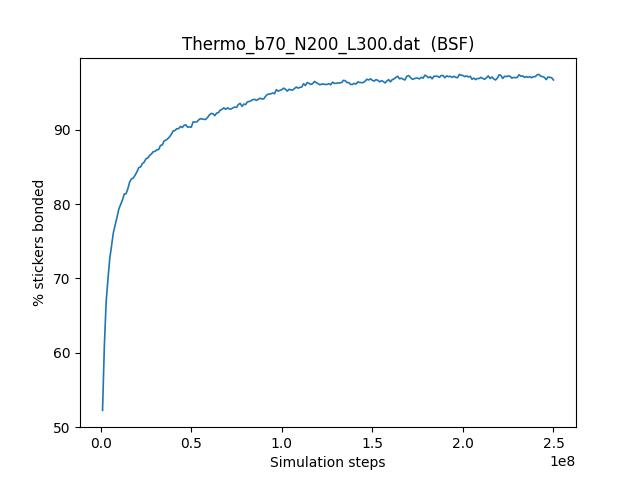
Example BSF time series.
Cluster Size vs Bound-Sticker Fraction (scatter)
| Script
plot_cSizeBSF.py| Input one LAMMPS
*.DATA snapshot| Action Detects connected clusters and scatter‑plots cluster size
vs bound‑sticker fraction for every cluster (figure saved as
cSize_BSF_scatter.png).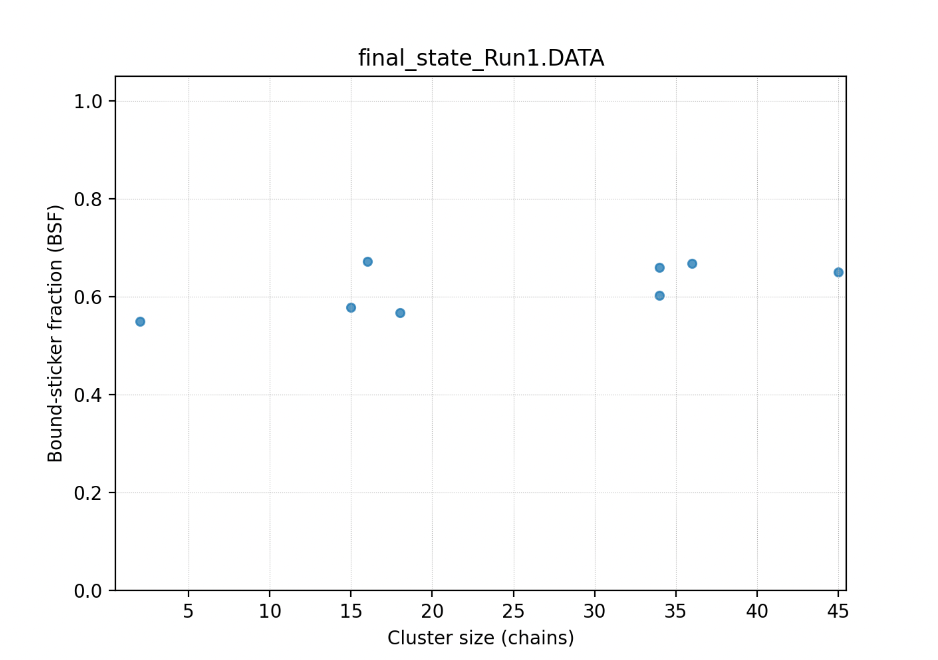
Cluster size vs BSF.
Sticker Dissociation Events
| Script
plot_SD.py| Input
BondData_<run>.dat (3‑column cumulative formed / brokencounters)
| Action Converts cumulative counts to per‑interval break events and
plots a line‑style time series (
SD.png).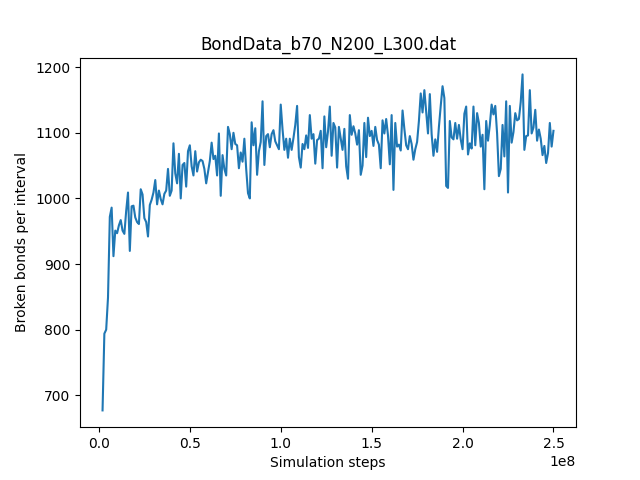
Dissociation events per Δt.
Cluster-Size Distribution
| Script
plot_cSize.py| Input one
*.DATA snapshot| Action Plots the fraction of chains in each cluster size s
(histogram saved as
cSize.png).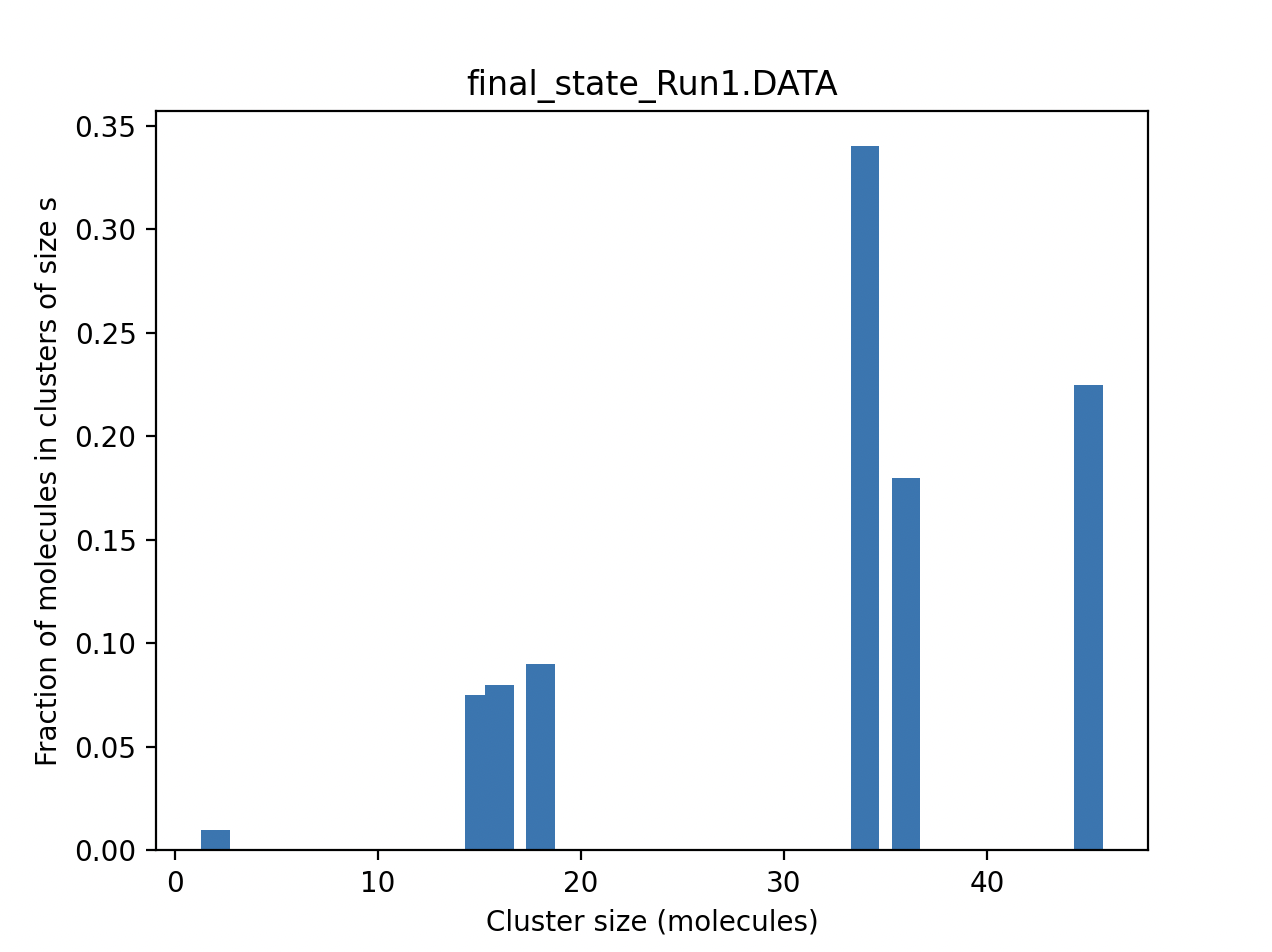
Cluster-size histogram.
Radial Sticker / Spacer Density
| Script
plot_radialDist.py| Input one
*.DATA snapshot (types 1/3 = stickers, 2/4 = spacers)| Action Computes volume‑normalised radial density profiles for stickers
and spacers (figure saved as
RD.png).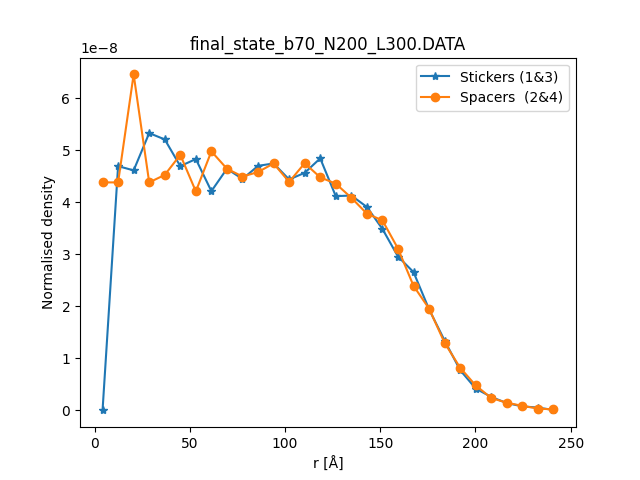
Sticker vs spacer radial densities.
Chain-Neighbour Histogram
| Script
plot_neighCount.py| Input one
*.DATA snapshot| Action Builds a graph whose nodes are chains and whose edges are sticker
bonds between different chains; bar‑plots the degree distribution
(histogram saved as
neigh_hist.png).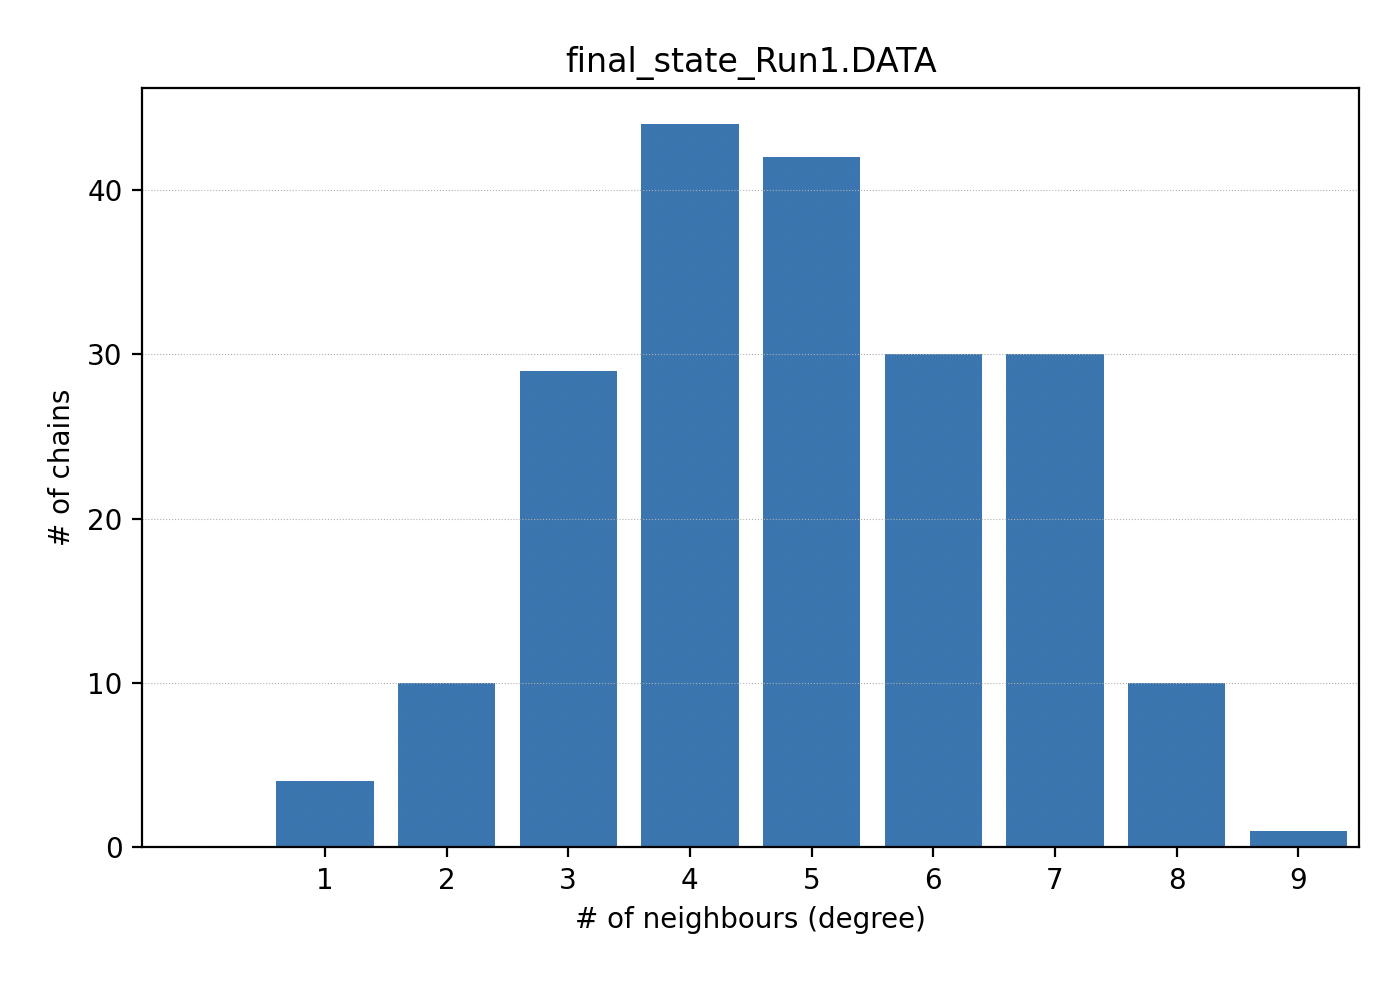
Chain-neighbour histogram.
Sticker-Bond Multiplicity per Chain Pair
| Script
plot_pair_bonds.py| Input one
*.DATA snapshot| Action Builds a MultiGraph in which nodes are chains and **each
type‑1 ⇄ type‑3 sticker bond becomes an edge**.
For every neighbouring chain pair the helper counts the *number of parallel
edges* (i.e. how many sticker bonds connect that pair) and histograms those
counts (figure saved as
pair_bonds_hist.png).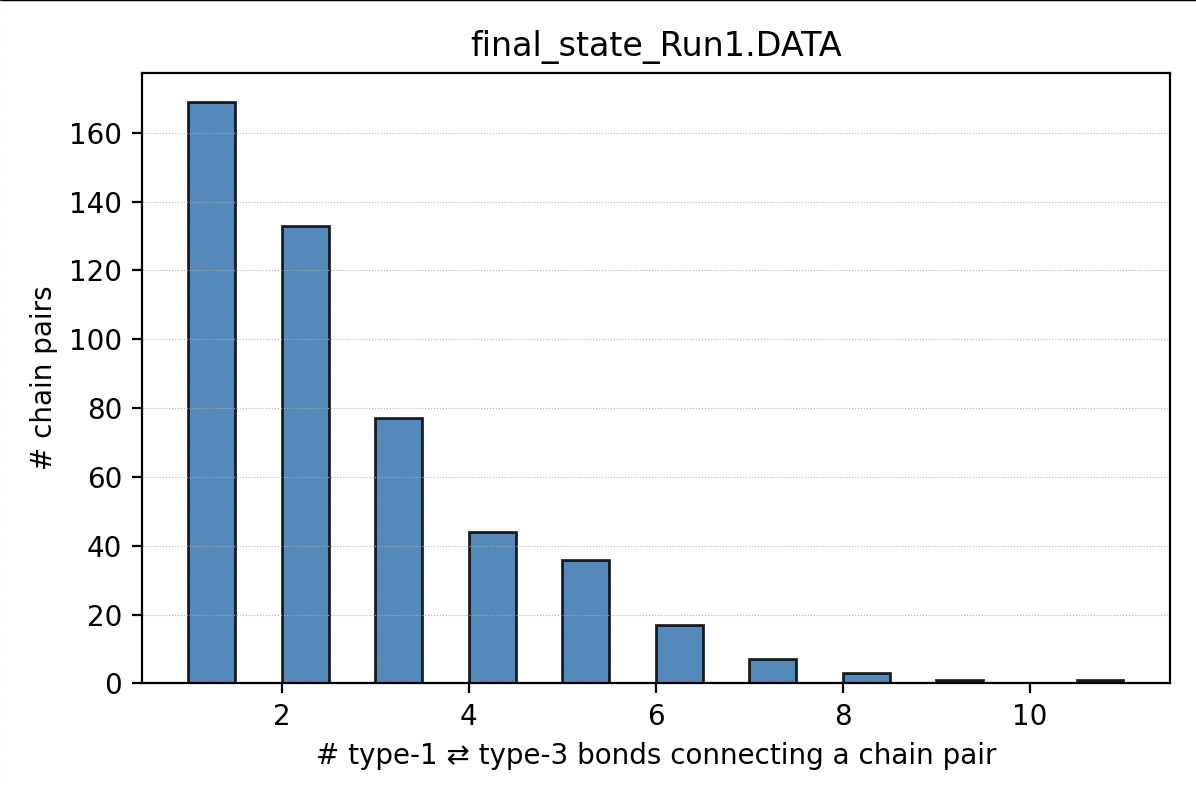
Example histogram of sticker-bond multiplicities.
Inter-molecular Sticker‑Sticker Distances
| Script
plot_sticker_dist.py| Input one or more
*.DATA snapshots| Action For every file, measures all pair‑wise distances between
type‑1 and type‑3 atoms residing on different molecules; overlays
raw‑count histograms (
sticker_dist.png). bins_w and max_r canbe tuned via flags.
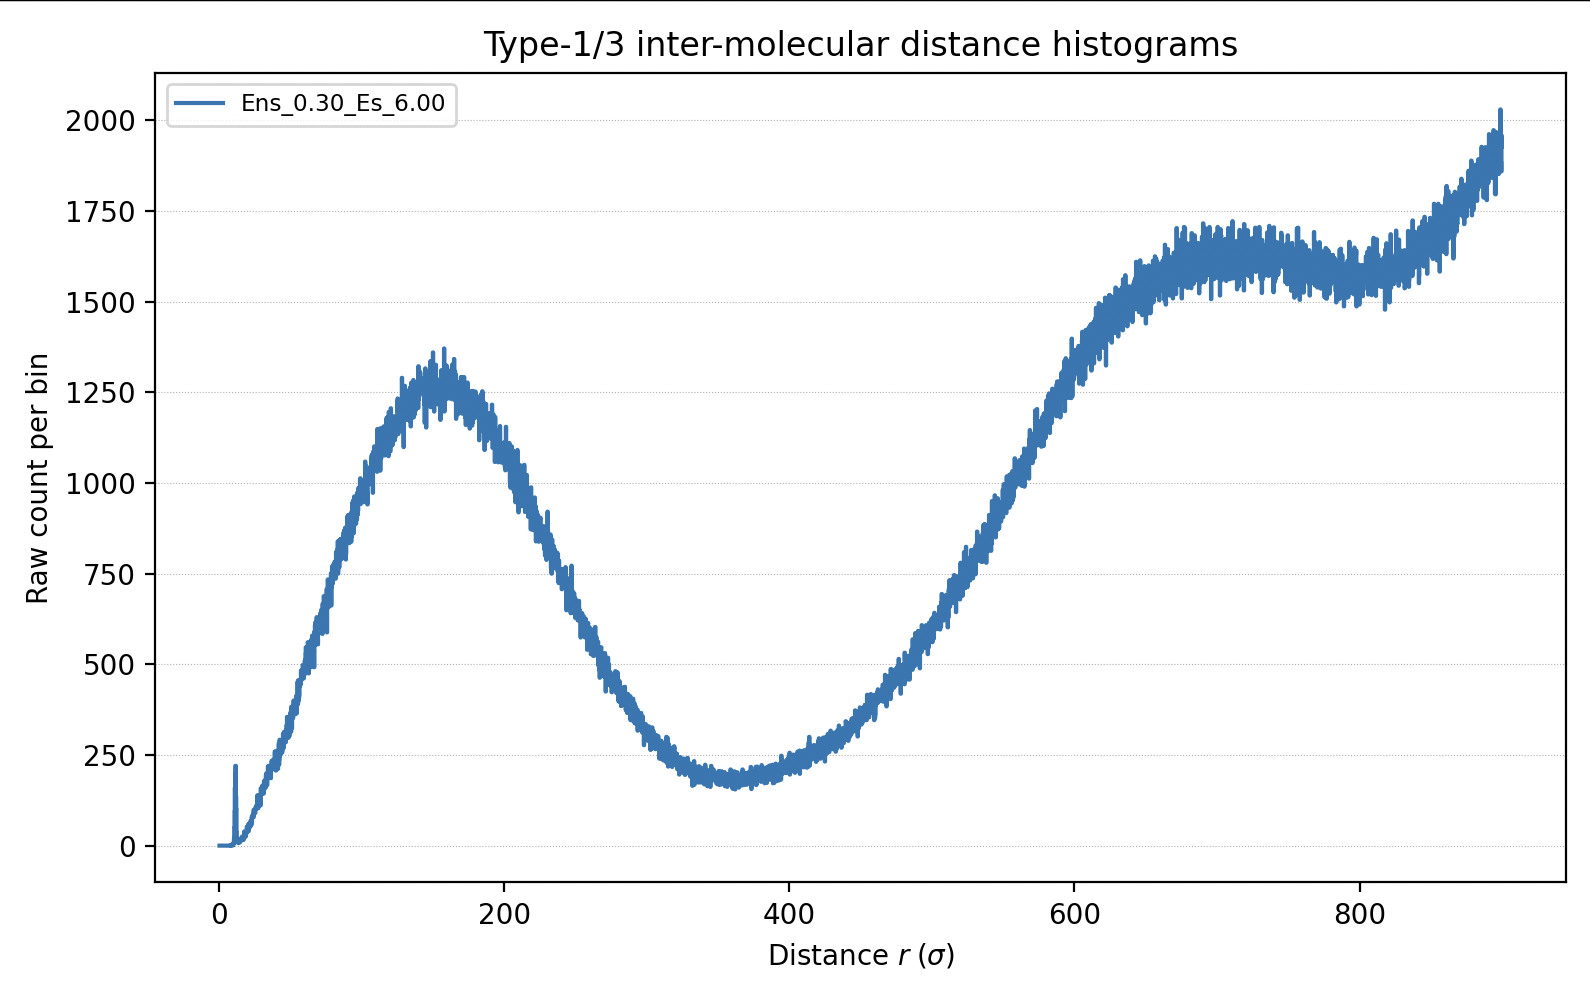
Sticker‑sticker distance distributions.